
“Quality comes not from inspection but from the improvement of the production process,” was notably stated by William Edwards Deming, widely acknowledged as the leading management thinker in the field of quality. This quote strongly resonates with the key objective of statistical process control (SPC), one of his pioneering quality management strategies.
So, what is SPC? In a nutshell, it refers to a quality control approach that utilizes statistical techniques for the supervision and regulation of a process to guarantee its adherence to predefined specifications. SPC is utilized for the purpose of managing and enhancing production processes, with the goal of boosting both the efficiency of processes and the quality of the resulting products.
As the times are changing with the sophistication and modernization of the food supply chain, SPC, as a significant aspect of the conventional paradigm of quality, gained momentum in food quality management over the past few years. Though primarily used as a quality management strategy, SPC has multiple functionalities in the food industry by collecting and analyzing real-time data during various stages of production to identify and address variations, deviations, or abnormalities that could impact product integrity and safety.
In this article, we will delve into the different elements for food processors to bear in mind for successfully establishing a statistical process control in their manufacturing unit as part of their food quality management efforts.
Statistical Process Control As A Subset Tool of Six Sigma
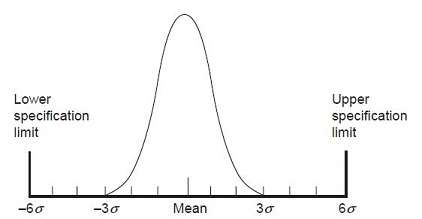
Six Sigma is a quality enhancement initiative with the prime purpose of minimizing defects to a level of 3.4 parts per million (PPM) through the reduction of process variations. The term “Six Sigma” is derived from a statistical concept where the goal is to achieve a process performance that is six standard deviations away from the mean, resulting in an extremely high level of quality and consistency. SPC is a subset tool of Six Sigma used to keep a close eye on production operations to spot any abnormalities and alert the company so they can fix it before it gets worse.
Reference: https://asq.org/quality-resources/six-sigma
At the heart of Six Sigma is a focus on measuring and analyzing the performance of processes in order to identify and eliminate variations that can lead to defects or errors. This is achieved through a structured methodology known as DMAIC, which stands for Define, Measure, Analyze, Improve, and Control. Each phase of DMAIC has specific goals and activities:
- Define: In this phase, the project goals, scope, and customer requirements are clearly defined. This helps ensure that the improvement efforts are aligned with the needs of both internal and external stakeholders.
- Measure: During this phase, relevant data is collected, and measurements are taken to assess the current performance of the process. This step helps quantify the extent of variability and identify key areas of concern.
- Analyze: The data collected in the previous phase is analyzed to identify the root causes of defects or inefficiencies. Statistical tools and techniques are employed to pinpoint the factors contributing to process variations.
- Improve: In this phase, solutions are developed and implemented to address the identified root causes. These solutions are tested and refined to ensure they have a positive impact on process performance.
- Control: The improvements made in the previous phase are integrated into the process, and measures are put in place to monitor and sustain the enhanced performance over time. Control mechanisms are established to prevent the re-emergence of defects and variations.
Examining the Concept of Statistical Process Control
History
SPC gained its initial prominence after World War II, in 1950, within the rapid development of the Japanese economy and manufacturing sector by promoting statistical tools, thanks to William E. Deming, who expanded upon the concepts originally formulated by Walter A. Shewhart in 1920. Nevertheless, it wasn’t until 1980 that the Western manufacturing industry swiftly embraced this method for its own specific purposes.
With the growth of industries and technology, SPC became well-known and spread beyond manufacturing into various sectors, including food industries, shaping the way organizations manage and optimize processes to meet quality standards.
Objective
SPC seeks to take the data generated from the manufacturing processes and use it in a more productive way. The key objective is to harness statistical tools and analytical techniques to extract data for gaining information and insights into manufacturing processes. These insights are then utilized to implement and install effective controls within the processes.
SPC aids in ensuring that the process operates efficiently, resulting in an increased production of products that align with specifications while minimizing waste, rework, or scrap, and it can be applied to any process where the “conforming product” output can be measured, such as manufacturing lines.
Importance of SPC for Food Manufacturers
Every aspect of the food supply chain generates data, and a significant portion of this data collected by food businesses is retained as evidence for compliance. It also presents an opportunity for food establishments to comprehend the processes or propel enhancement as this data embodies an ocean of insight, which, if effectively put into use, can help augment process productivity, conformance, and worker experience.
Food safety and quality standards are evolving to emphasize a process-based approach to developing, implementing, and improving food quality management systems aligning with compliance and risk-based models. SPC simply helps companies move towards prevention-based quality control instead of detection-based quality controls. This is why several GFSI standards have begun to realize and integrate SPC within its guidelines.
Recent revisions to multiple standards are compelling enterprises to acknowledge the necessity of identifying and implementing SPC and other statistical analyses. For instance, the widely recognized food quality management standard ISO 22000 encompasses the Plan-Do-Check-Act (PDCA) cycle, in which the “Check” phase refers to monitoring, measuring, and verifying processes and the consequent products and services, followed by evaluating the information and data, and reporting the results. SPC becomes highly relevant in this context by being a tool to facilitate continuous monitoring of processes and analyzing operation data, enabling manufacturers to demonstrate compliance with ISO 22000 requirements effectively. SPC’s data-driven methodology ensures that deviations are promptly detected and addressed, reducing the risk of food quality issues.
Key Components for Understanding SPC
• Process Variation
The basic assumption of SPC is that all processes are generally subject to variation. Variation is the inherent tendency of a process to deviate, move, shift, or vary around a mean central point. It is a phenomenon that can be observed throughout nature as all processes have variations and are impossible to eliminate. Variations can belong to any of these two categories:
- Common Cause: This type of variation in a process arises by chance and cannot be attributed to any specific factor. It represents the inherent variability within the process. When a process is affected by common cause variation, it remains stable, and its behavior is predictable.
- Assignable Cause: Alternatively referred to as “special cause,” it is the type of variation in a process that is not due to chance. It can be identified and eliminated by identifying its root cause. When a process is influenced by an assignable cause, it becomes unstable, and its behavior cannot be easily predicted.
• Process Data
As Deming rightly stated, “Uncontrolled variation is the enemy of quality.” So, how to control process variation? Every process data has a typical or normal distribution around the mean, and most readings will fall close to the mean while fewer readings will fall further away from the mean value. By understanding and knowing the degree and nature of variability, it is possible to control the variation. In order to break down the characteristics of variations, data collection is essential. Data comes in two types: variable data (numerical) and attributes (non-numerical). In food industries, data comes in many forms, namely, process parameters such as time, temperature, pressure, pH, etc., audit outcomes, non-conformance, critical control point monitoring data, and sanitation and cleaning results.
• Data Monitoring
Controlling process variations necessitates monitoring and measuring the collected data, and in food companies, the principle of Hazard Analysis Critical Control Point (HACCP) accomplishes this goal. Monitoring data in food quality management is based on two requirements:
- Compliance with regulations and customer demands
- Risk in the process or product
• Analyzing Data
Measuring an ample amount of data can be followed by simply determining if the data point meets the specification or analyzing the data using SPC techniques to describe the process in terms of capability to meet the specification consistently. Even if process data yields compliance with the mandated specifications, slight shifts in the process could eventually lead to out-of-spec results over time. With the application of SPC, these variations can be revealed and rectified in time, thereby proactively preventing their occurrence in the long run.
General Steps for Implementing SPC in the Process
- Identify the Processes: To begin, specify the crucial processes that significantly influence the product’s output or the process that holds paramount importance to the customer.
- Define Measurable Process Attributes: Recognize the specific attributes that have to be measured throughout the production phase.
- Determine the Measurement Method: Formulate instructions or a procedure for the measurement method, including the instruments employed for measurement.
- Develop Subgroup Strategy and Sampling Plan: Moving forward, strategize the size of subgroups and frequency of the samples to be collected based on the product’s critical nature.
- Collect Data and Plot the SPC Chart: Proceed to collect data according to the defined sample size. Choose an appropriate SPC chart considering the type of data (Continuous or Discrete) and the size of subgroups.
- Describe the Natural Variation of Attributes: Calculate the control limits. Derive the upper control limit (UCL) and the lower control limit (LCL) for both X-Bar and Range. For the X-Bar chart, the UCL and LCL help indicate if the process mean is consistent and within acceptable bounds. On the other hand, for the Range chart, the UCL and LCL help gauge the variability or spread of data within subgroups.
- Monitor Process Variation: Interpret the control chart, scrutinizing any out-of-control points and discerning patterns. Given that this is a continuous endeavor, consistently oversee process variability.
- Execute Corrective Actions: If any out-of-control points or patterns are identified, implement appropriate corrective actions to bring the process back under control and prevent further deviations.
- Ensure Continuous Enhancement: Continuously analyze the gathered data and insights from the control chart to identify opportunities for process improvement and refinement, aiming for ongoing enhancement of the production process.
Application of Statistical Process Control in the Food Industry
With the general steps of SPC application in consideration, let’s delve into the application of SPC in the food industry:
Data Collection
Relevant data points are collected during the production process. These data points could include measurements of temperature, pressure, pH, moisture content, weight, and other critical factors that influence the quality of the final product.
Control Charts
A control chart is one of the primary statistical process control techniques (SPC). The control chart is a process‐behavior chart for the graphical display of quality characteristics that are measured or computed from a sample versus the sample number or time. Furthermore, the control chart contains a center line that represents the average value of the quality characteristics and two other horizontal lines known as the upper control limit (UCL) and lower control limit (LCL). These charts help visualize the data collected over time and provide insights into the stability and variability of the process.
X-Bar and R-Chart – The X-Bar and R-chart are quality control charts utilized to track the mean and the variation of a process through samples collected within a specified timeframe. They are employed to oversee the process performance of continuous data, such as weight or volume, gathered in subgroups at predetermined intervals. It monitors the average (X-Bar) and range (R) of a sample taken at regular intervals.

X bar – S Charts – X Bar – S charts are frequently used control charts for evaluating both the process mean and standard deviation over time. They come into play when subgroups have large sample sizes, and the S chart provides a better understanding of the spread of subgroup data than the range.

X-MR Charts (Individual-Moving Range Charts) – An Individual-Moving Range (I-MR) chart is the same as an X-MR chart. This chart is employed when collecting one observation at a time and not as continuous data in groups.

Run Charts – A run chart displays observed data as they evolve over time. This basic graph arranges data values in sequential order, serving as a tool to test for randomness in the process. It is limited to single-point data.
P Chart and NP Chart – This chart is used for monitoring the proportion of defective items in a sample (P) or the count of defective items (NP). These charts are suitable for categorical data. Opt for a P chart when the data displays a percentage of defects or non-confirming units in a given number of samples. Opt for an NP chart when the data is collected in same-sized subgroups, and they demonstrate how the process changes over time, measured by the number of nonconforming items (defectives) produced.


C Chart and U Chart – Similar to the P and NP charts, these charts are used for monitoring the count (C) or rate (U) of defects in a sample.

The type of control chart depends on the following factors:
- Type of data being charted (continuous or attribute)
- Required sensitivity (size of the change to be detected) of the chart
- Whether the chart includes data from multiple locations or not
- Ease and cost of sampling
- Production volumes

Reference: https://www.qualitygurus.com/seven-quality-tools-control-charts/
Establishing Control Limits
Control limits are set on the control charts to define the acceptable range of variation. These limits are usually based on historical data or industry standards. Data points falling within the control limits are considered acceptable, while those falling outside the limits might indicate an issue with the process.
Here is how you can calculate the control units:
Estimate the standard deviation (σ) of the sample data
To calculate Upper Control Limit, UCL = Average + 3 x σ
To calculate Lower Control Limit, LCL = Average – 3 x σ

Reference: https://opexresources.com/introduction-statistical-process-control/
Other key formulas needed in the SPC process are for calculating Cp (Capability) and Cpk (Performance) to determine whether the process is able to meet specifications.
Cp = (USL – LSL) / (6 σ)
Cpk = min[(USL – X) / (3 σ), (X – LSL) / (3 σ)]
where, X = process average
LSL = Lower Specification Limit
USL = Upper Specification Limit
σest = Process Standard Deviation
Monitoring and Analysis
Regularly analyzing the control charts helps identify trends, shifts, or patterns in the process. Any points beyond the control limits, repeated patterns, or other unusual occurrences can signal the need for investigation and corrective action.
Corrective Actions
When the process goes out of control or shows signs of potential issues, corrective actions are taken. These actions could involve adjusting process parameters, troubleshooting equipment, modifying procedures, or implementing process improvements.
Continuous Improvement
SPC is not a one-time activity but a continuous process. The insights gained from the control charts and the corrective actions taken contribute to process improvement efforts over time as they equip food businesses to understand how capable their food industry processes are for producing spec-conforming products.
Employ Statistical Process Control for your Food Industry With Smart Food Safe
With the tech-enabled features of Smart Food Safe‘s multitude of digital modules, food establishments can implement statistical process control (SPC) for a robust quality control system that facilitates the detection of variations and deviations in food production processes, ensuring consistent product quality while limiting waste and risks.
Our custom reporting feature empowers businesses in the food industry by serving as a valuable tool for enabling the creation of specialized process control charts and identifying and addressing compliance gaps within the food production processes. Intuitive dashboards provide a consolidated place for presenting these charts, offering a visual representation of key performance indicators and critical control points, aiding businesses in closely monitoring their operations. In this way, businesses can proactively pinpoint areas for refinement, optimize their processes, and ultimately bolster the overall safety and quality of their food products.
